This is a continuation from part 1, which condenses information from Ulrich Drepper’s paper - “What Every Programmer Should Know About Memory”. We cover Chapter 3 on CPUs.
Cache Write Behaviour
No instruction modifies an entire cache line at once, so a write always starts with a load — the cache line must be fetched before any byte in it can be changed. A modified line that hasn’t been written back to main memory is called dirty.
When a new line needs to be loaded into a full cache, something must be evicted. Eviction cascades down the hierarchy: L1d → L2 → L3 → main memory, with each level progressively more expensive.
Inclusive vs exclusive caches handle this differently:
- Inclusive (Intel): every line in L1d is also present in L2. Evicting from L1d is cheap since the data is already in L2, but memory is duplicated across levels.
- Exclusive (AMD, VIA): a line exists in exactly one level. Loading into L1d only touches L1d, but eviction must push the line down to L2 explicitly.
The Test
We want to measure how access pattern (sequential vs random) and working set size interact with the cache hierarchy.
Note: Drepper’s measurements were taken on a Pentium 4 (64-bit mode) and Intel Core 2 — both inclusive cache designs. Results on other hardware (e.g. AMD with exclusive caches, or Apple Silicon with NINE caches) will differ.
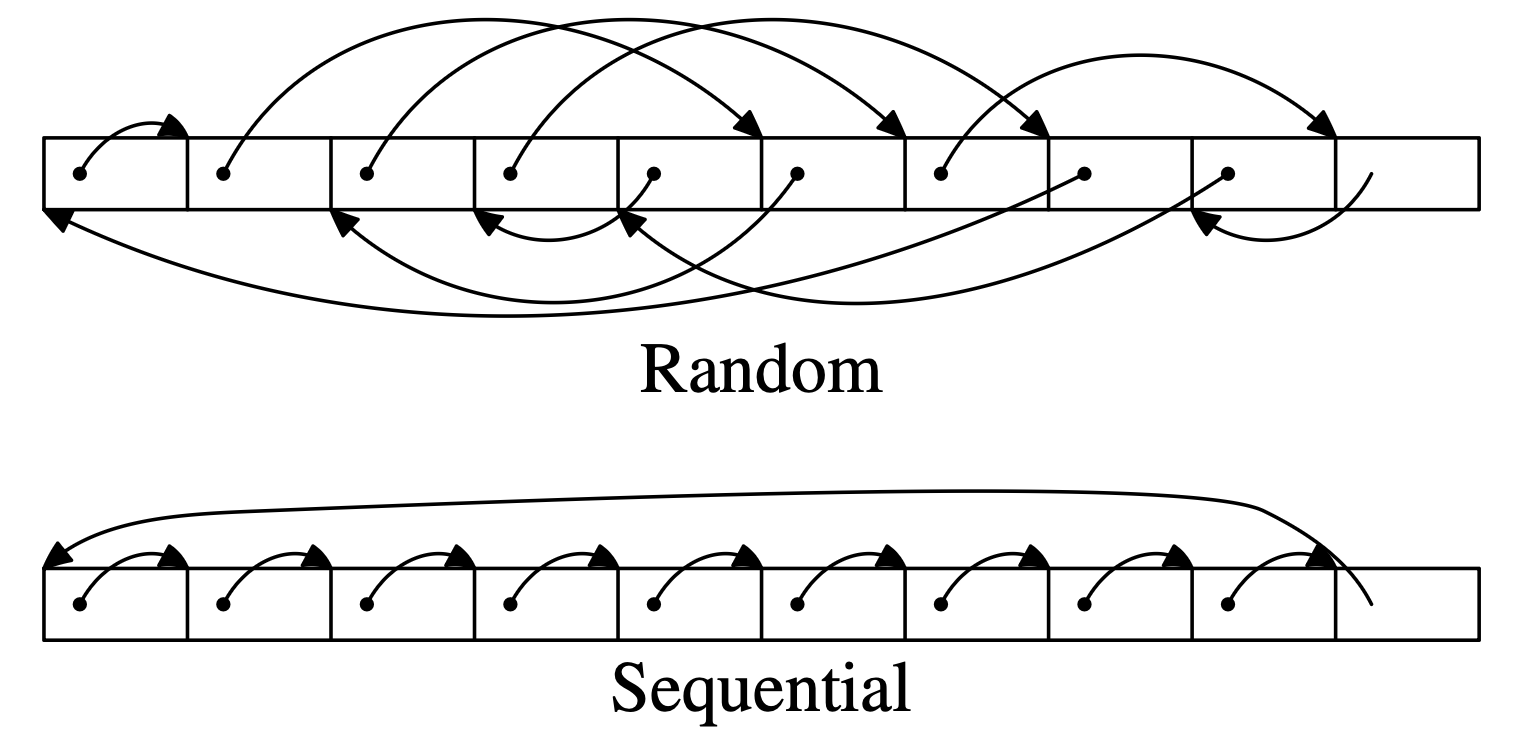
Sequential: each element’s n points to the next element in memory order, so pointer chasing happens to walk linearly through the array
Random: the n pointers are shuffled, so each dereference jumps to an unpredictable location
struct l {
    struct l *n;
    long int pad[NPAD];
};
By always advancing via the pointer rather than incrementing an index, both tests do identical work — the only variable is whether the next memory access is predictable. This isolates exactly one thing: whether the hardware prefetcher can anticipate the next access and hide latency.
The list is circular, so the traversal loops back to element 0 after visiting all N elements. This is what makes the benchmark clean: once the working set exceeds a cache level, every access at that level is a guaranteed miss. By the time the traversal returns to element 0, all N elements have been loaded through the cache since the last visit, so element 0 has long been evicted. There are no lucky hits from temporal locality — each working set size exercises exactly the cache level being measured.
The pad field controls element size.
With NPAD=0, each struct is 8 bytes and 8 elements share a cache line.
With NPAD=7, each struct is exactly one cache line (8 bytes for pointer, long int size is 8 bytes), so every iteration requires a fresh fetch.
The working set is varied to push data through each cache level:
- L1d (16KB = 2^14 bytes)
- L2 (1MB = 2^20 bytes)
- Main Memory
This lets us observe miss costs and prefetcher effectiveness at each level.
Brief: Hardware Prefetching
Prefetching is a technique used to hide the latency of memory access by loading data from main memory into the CPU cache asynchronously before the processor actually needs it.
This allows memory operations to overlap with the execution of other instructions, reducing the time the CPU spends stalled while waiting for data.
We only refer to hardware prefetching for now.
Sequential Access, NPAD=0
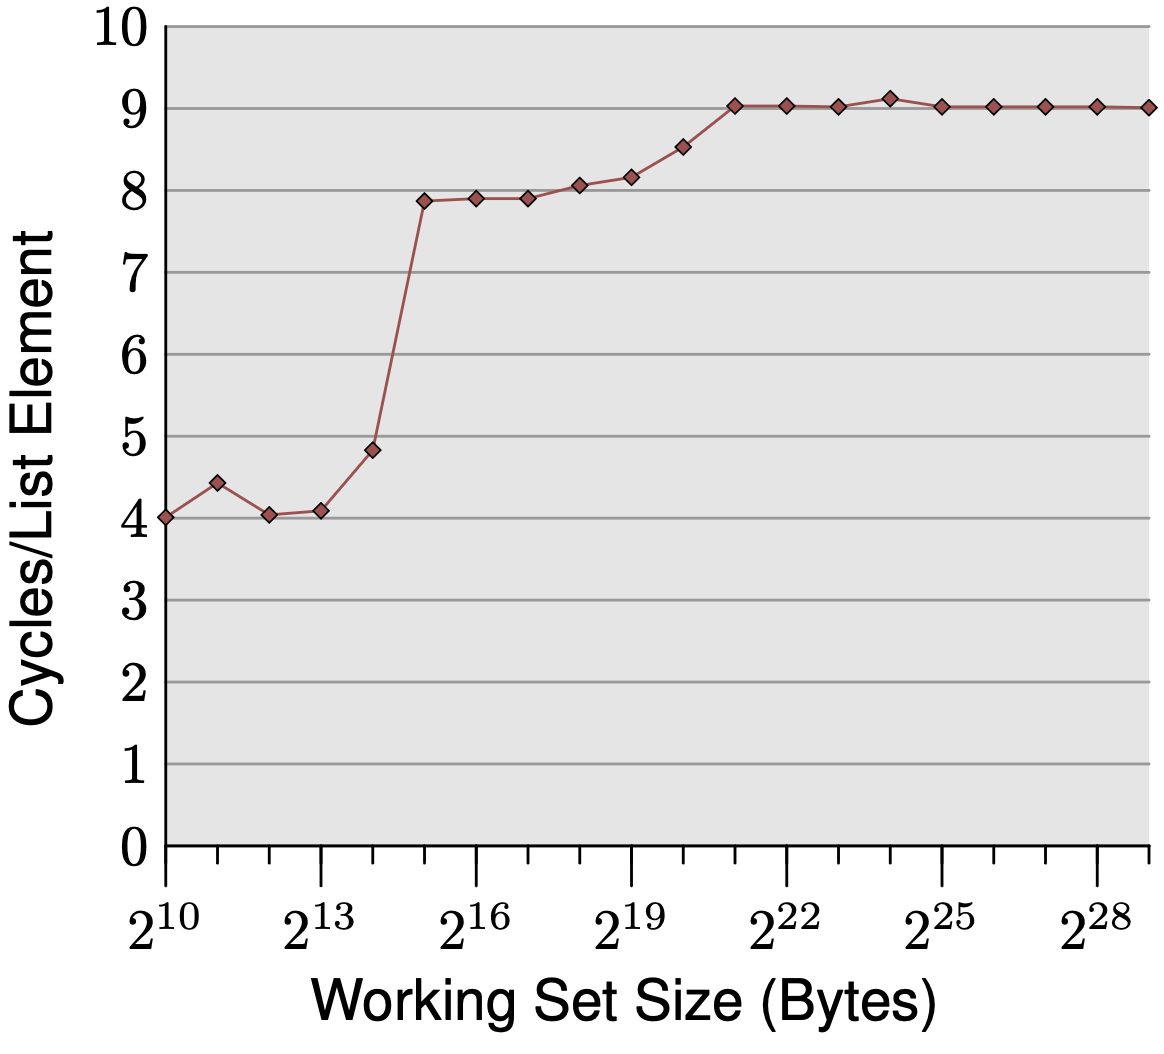
The graph plots cycles per element against working set size, showing three distinct plateaus:
Up to 2^14 bytes (16KB): ~4 cycles. The working set fits entirely in L1d, and 4 cycles is exactly the expected L1d hit latency on the P4.
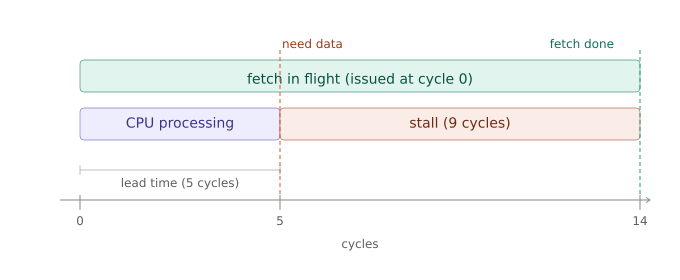
2^15 to 2^20 bytes (1MB): ~9 cycles. The working set spills into L2, whose raw latency is 14+ cycles — yet we only observe 9. The prefetcher hides the gap: sequential layout lets the CPU detect the stride and fetch the next cache line in the background, so by the time it’s needed, most of the latency is already paid.
Above 2^21 bytes: still ~9 cycles despite main memory’s 200+ cycle raw latency. The prefetcher issues fetches far enough ahead that almost the entire DRAM latency is hidden behind computation.
The transitions are soft rather than sharp because the cache is shared with the OS and other system activity.
Sequential Access, Varied NPAD
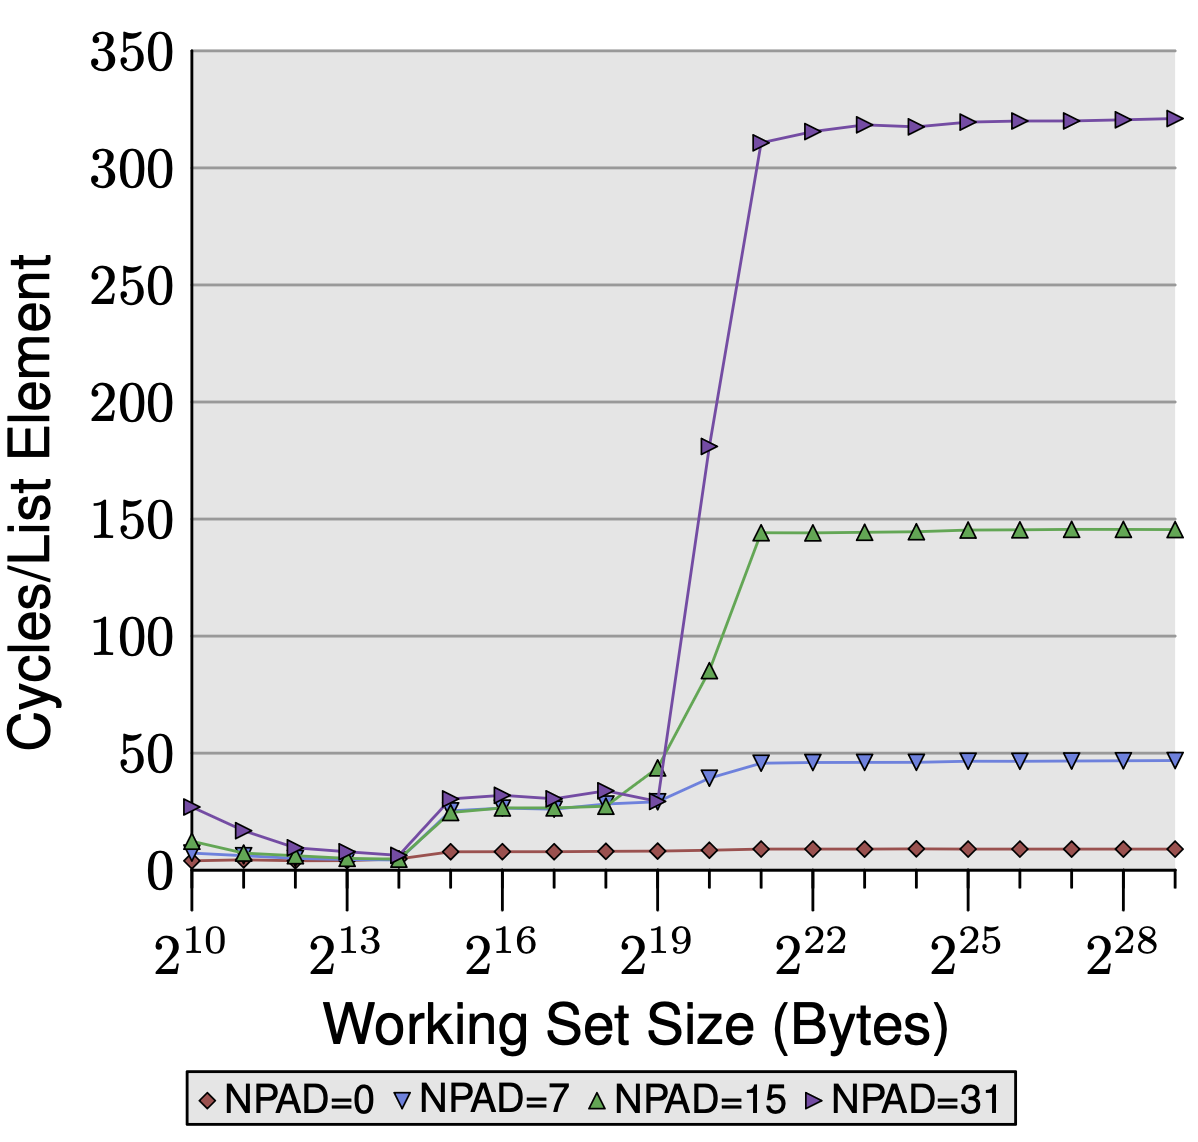
The graph plots cycles per element against working set size for four element sizes (NPAD=0, 7, 15, 31), corresponding to element sizes of 8, 64, 128, and 256 bytes.
L1d region (up to 2^14 bytes): all four lines match. No prefetching is needed since everything fits in L1d, so element size doesn’t matter — every access hits regardless.
L2 region (2^15 to 2^20 bytes): the three larger NPAD lines converge at ~28 cycles — the raw L2 access latency. With NPAD=7 and above, each element is exactly one cache line, so every iteration demands a fresh fetch with almost no computation in between.
The prefetcher has no breathing room and stalls on every iteration. NPAD=0 stays low because 8 elements share one cache line, giving the prefetcher 8 iterations to finish the next fetch in the background.
Beyond L2 (above 2^21 bytes): the four lines diverge dramatically — NPAD=31 reaches 320+ cycles, NPAD=15 ~150, NPAD=7 ~50, NPAD=0 stays flat near 10.
Two compounding factors explain this.
First, larger elements consume more cache lines per iteration, leaving the prefetcher less time to hide latency.
Second, the hardware prefetcher cannot cross page boundaries — it must wait until the CPU actually accesses the first address of the next page before resuming.
With NPAD=31 only 16 elements fit per 4KB page, so these full-latency stalls occur every 16 iterations. With NPAD=0, 512 elements fit per page, so boundary penalties are negligible.
Prefetching only helps when two things line up: the access pattern is predictable, and the element size gives the prefetcher enough breathing room between fetches and across page boundaries.
TLB Misses With Varied NPAD Size
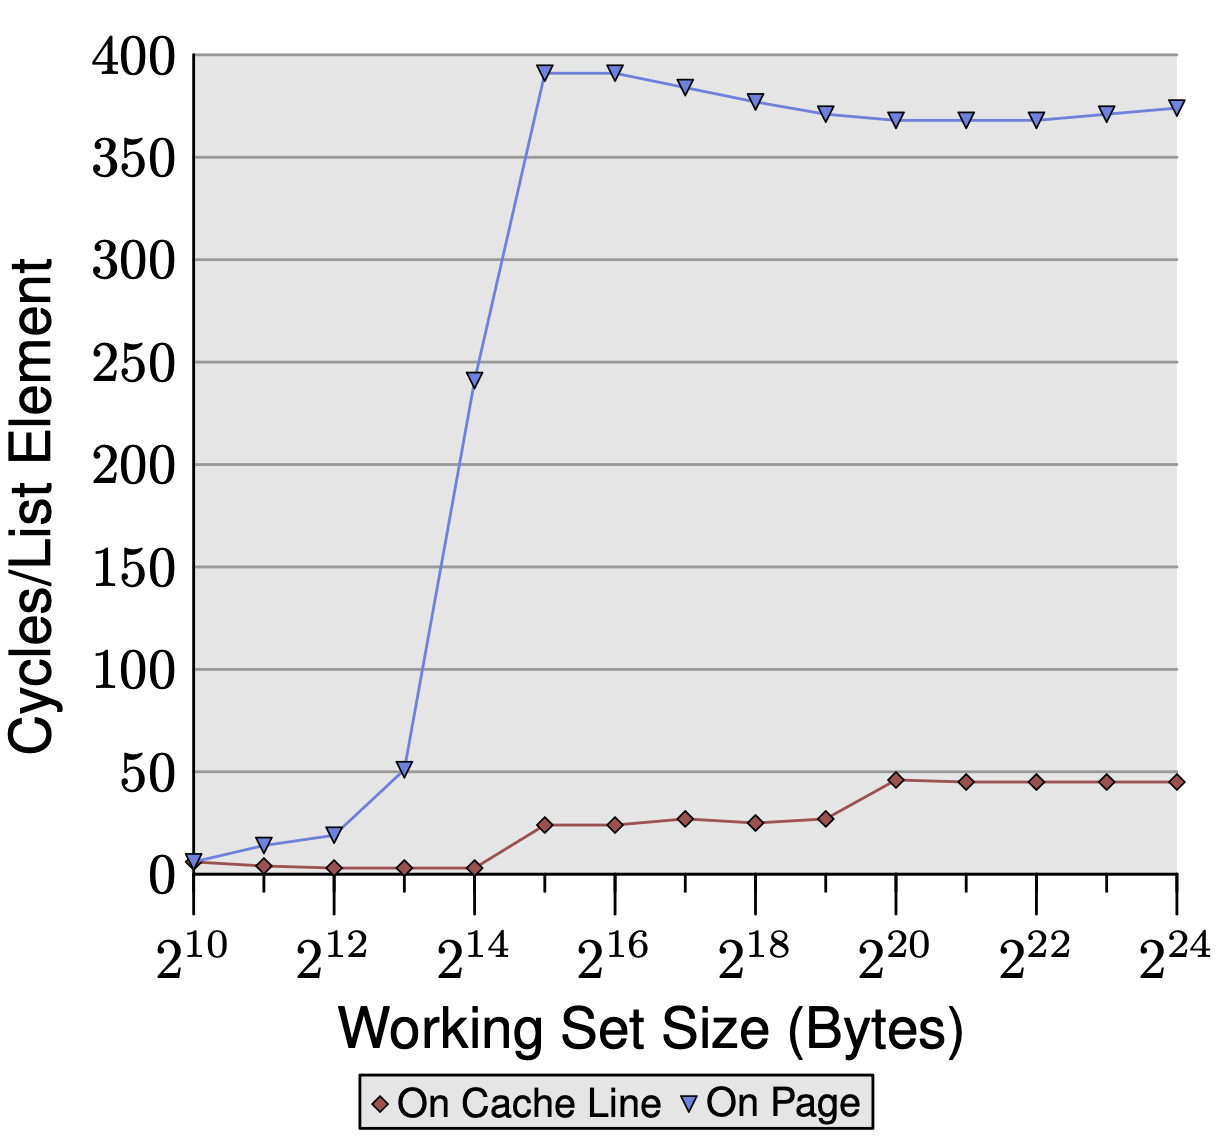
We can also measure the overhead due to TLB misses by comparing two memory layouts: elements packed contiguously (many per page) versus one element per page (forcing a TLB lookup on every access).
Take NPAD=7, so each element is 64 bytes (one cache line), and pages are 4KB.
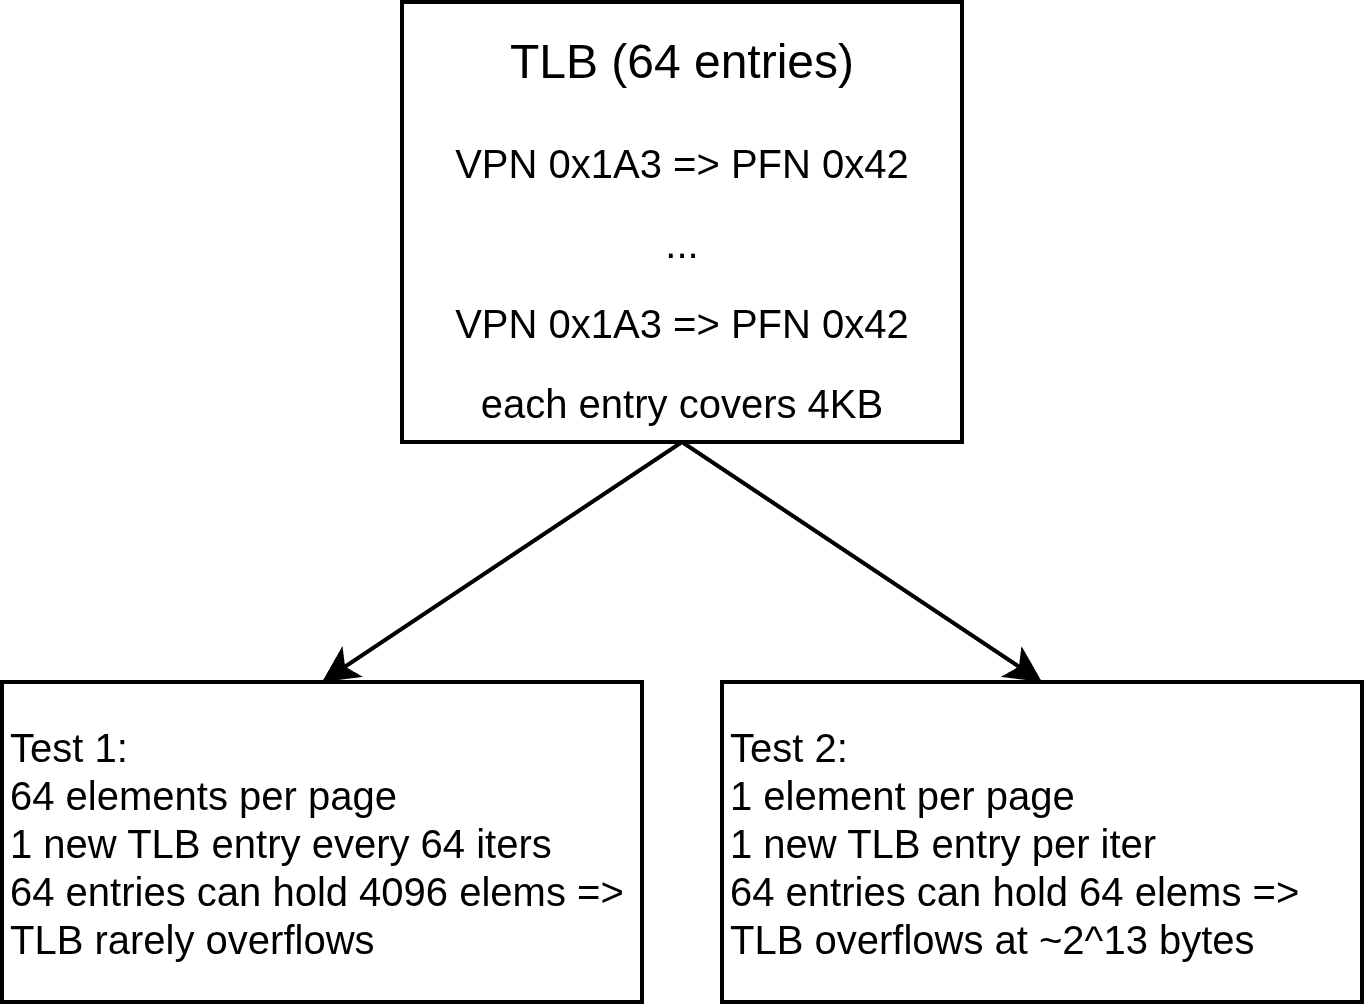
Test 1: Sequential layout Elements are packed contiguously. Each page holds 4096/64 = 64 elements, so a new TLB entry is needed every 64 iterations — one TLB lookup amortized over 64 elements. TLB cost per element is low.
Test 2: One element per page Each element is placed at the start of its own 4KB page. Every single iteration lands on a new page, requiring a new TLB lookup every iteration — 64x more TLB lookups for the same number of elements. The TLB is small (say 64 entries). In test 2 after 64 elements, every access is a TLB miss, requiring a full page table walk (~100+ cycles). Larger element sizes like NPAD=15 and NPAD=31 fall between these extremes — fewer elements per page means more frequent TLB misses, which compounds the page boundary prefetcher stalls from earlier. Both penalties hit simultaneously.
Write Effects and Forced Prefetching
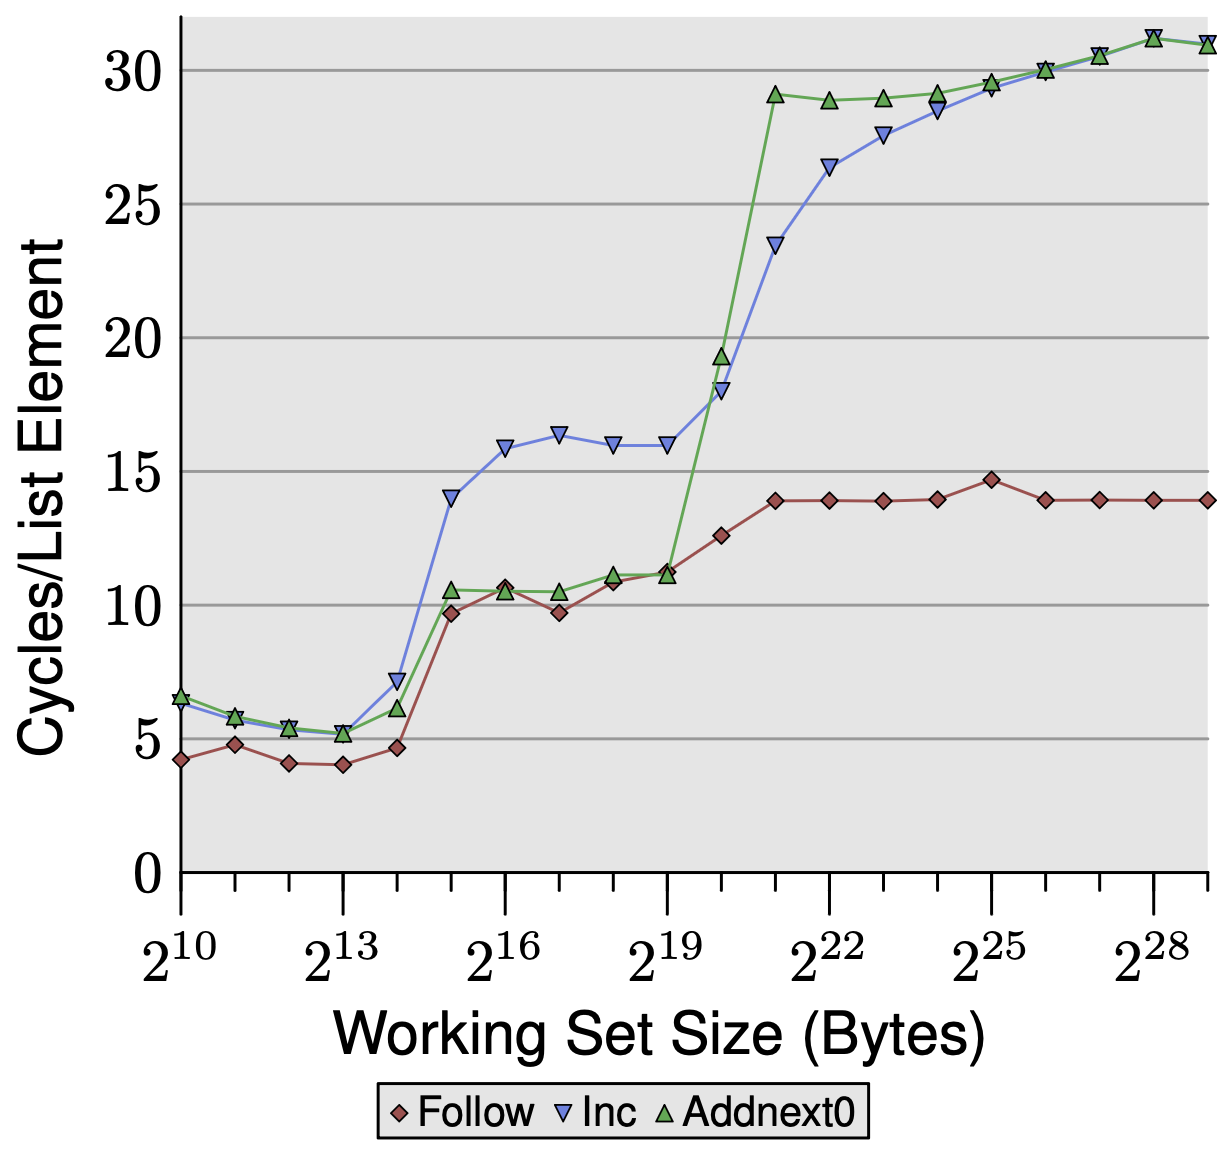
We add two new tests with 16-byte elements, alongside the baseline Follow test (read-only pointer chase):
- Inc: increment current element’s pad[0], then advance. Writes the current element but has no reason to touch the next one early.
- Addnext0: add next element’s pad[0] into current element’s pad[0], then advance. Reads ahead into the next element before advancing.
L1d: 16KB => 2^14 bytes; L2: 2MB => 2^21 bytes
In the L2 region: Inc sits visibly above Follow. The cost of arithmetic operations are negligible — the cost comes from write-backs. Modified cache lines are marked dirty and must be written back to L2 on eviction rather than simply discarded, consuming extra bandwidth.
Addnext0 matches Follow despite also writing. The read of next->pad[0] acts as a forced prefetch — the next element is already in L1d by the time the loop advances, which cancels out the write-back overhead.
Beyond L2: both Inc and Addnext0 plateau at ~28 cycles, double Follow’s ~14 cycles. Dirty evictions now consume FSB bandwidth for both a write (dirty line out) and a read (new line in), halving effective bandwidth. Addnext0 hits this plateau earlier (at 2^21 vs 2^22) because it always has one extra element resident in cache at any given time — the current element being processed and the next element already prefetched. Each element is still only read once, but the cache always holds one more live element than Inc does, so L2 fills up sooner.
Single Threaded Random Access
We now access elements in a random order, removing the benefits of prefetching.
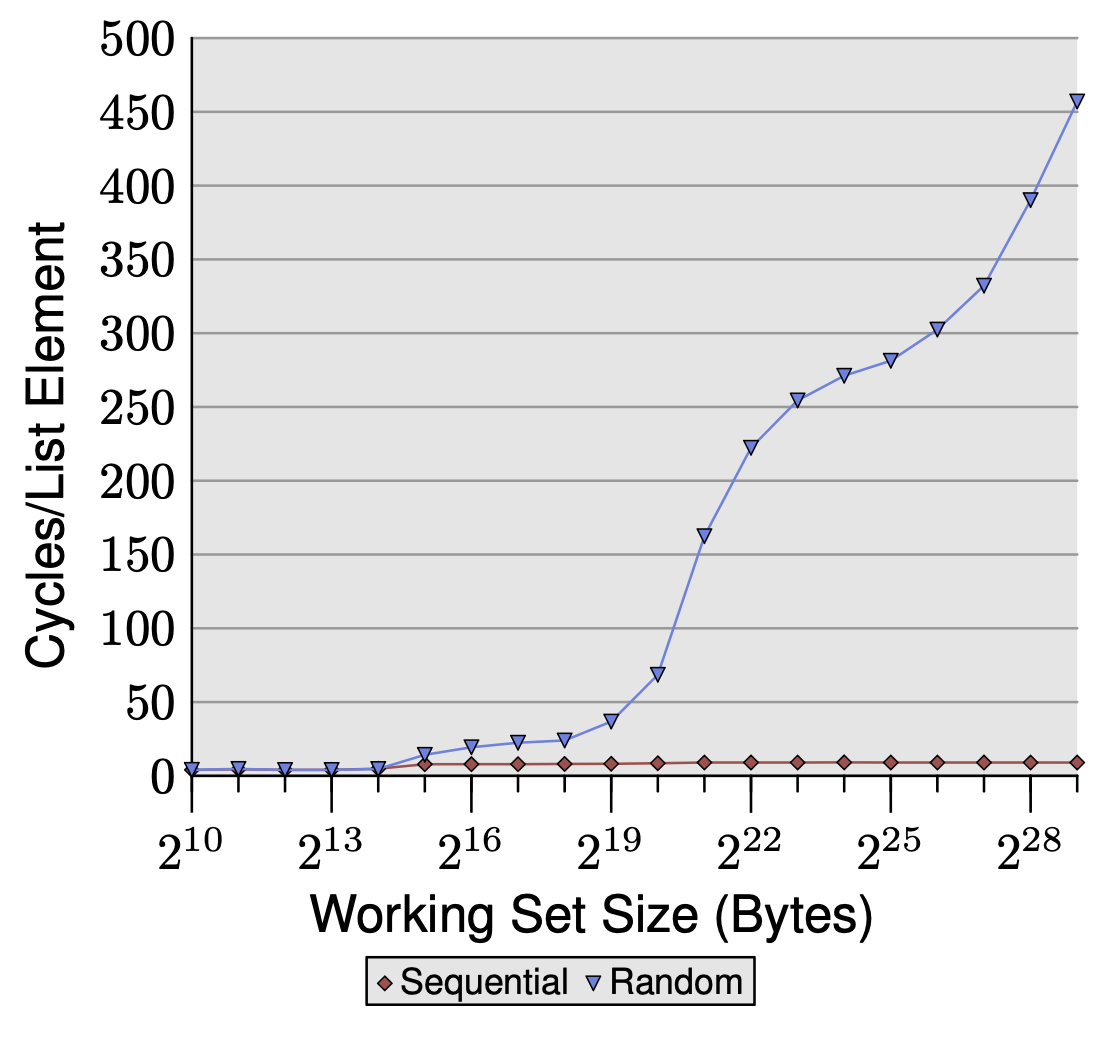
Random access costs exceed 200-300 cycles — more than raw memory latency The prefetcher is hurting performance by detecting spurious patterns in memory access, wasting FSB bandwidth on useless prefetches. This leaves less bandwidth for your actual demand loads, pushing latency above the theoretical maximum of 200-300 cycles.
Number of Cycles needed does not plateau as working set size increases As the working set grows, the L2 and TLB miss rates grow continuously with no stable equilibrium.
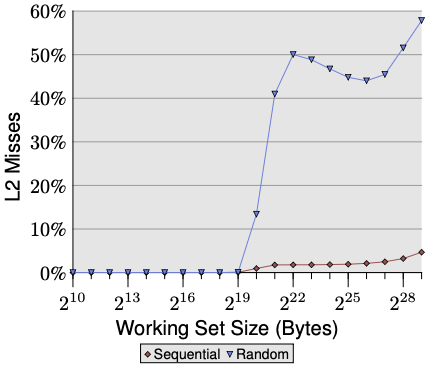
Sequential stays near 0% L2 miss rate across all working set sizes. The prefetcher keeps pulling lines into L2 ahead of demand, so almost every access is a cache hit regardless of how large the working set gets.
Random stays near 0% while the working set fits in L2 (below 2^20). Once it exceeds L2, miss rate jumps to ~50% immediately — because with a 2x overflow, only half the working set fits and random access has equal probability of hitting any address. Miss rate then trends toward 100% as the working set grows, with a slight dip around 2^22-2^25 where heavy TLB misses temporarily reduce the number of L2 accesses being counted, before rising again as both effects saturate.